Homepage

No tricks,
Just ticks.

Progress through a structured, rule-based simulation framework designed for clarity, control, and fair performance assessment.

From $49 · No hidden rules · Safe Payouts

3
Account models

Live
Risk monitoring

100%
Rules transparency

Fast
Safe payouts

0
Hidden conditions

Simulation disclosure — FairTicks operates within a simulated trading and evaluation framework. All trading activity, metrics, and results presented are part of a simulated environment and do not represent actual live trading results.

Available markets

What is FairTicks

A rule-based simulation platform built around disciplined performance.

FairTicks is not built to eliminate traders through obscure rules. It is built to evaluate real discipline, risk control, and consistency under a transparent, structured framework.

SIM

Simulated trading environment

Trade in a structured simulated framework designed to test discipline, risk behavior, and execution quality under controlled, predefined conditions.

Clear risk rules

Every account operates under fully transparent risk conditions. Limits, thresholds, and evaluation criteria are defined from day one.

+247 ticks

Performance evaluation

Consistency, execution quality, and risk management are measured through a controlled evaluation framework — not luck, not noise, not random aggression.

EVALPERF.12

Structured progression

Advance through account stages based on disciplined, measurable performance. The framework rewards control and consistency — not chaotic behavior.

Why Fairticks

Most platforms talk about opportunity.
FairTicks focuses on structure.

The evaluation environment is built to measure control, not random aggression. Every rule exists for a reason, and that reason is always communicated clearly.

Other platforms FairTicks
Other platforms Rules buried in fine print — hard to understand
vs
FairTicks Clear rules, written in plain language, accessible from day one
Other platforms Account conditions that change after you pass
vs
FairTicks Same account framework at every stage — no surprises
Other platforms No visibility over your risk exposure in real time
vs
FairTicks Live dashboard — know exactly where you stand at all times
Other platforms Reset used as a way to extract more money from traders
vs
FairTicks Reset is a structured second chance — capped, fair, transparent
Other platforms No access to your position history or trading data
vs
FairTicks Full position logs — every trade, every result, fully traceable
Other platforms Performance metrics hidden or incomplete
vs
FairTicks Detailed performance dashboard — consistency, risk, execution
01

Clear rules from day one

No confusing conditions. No hidden traps. Know exactly how the framework operates before you start.

02

Fair evaluation logic

The framework measures control, not random aggression. Discipline is the edge — not luck or speed.

03

Discipline-first approach

Consistency and risk management determine outcome. Chaotic behavior is not rewarded — it is filtered out.

04

Tick-based precision

Performance is evaluated in logical ticks — calibrated per asset and volatility regime. No arbitrary percentage rules.

05

Modern platform experience

Clean interface, live account metrics, real-time risk visibility. Built for focused execution — not distraction.

06

Built for trust

Everything is communicated with clarity. Traders understand the system they are entering — completely.

How It Works

Four steps. Zero ambiguity.

The process is straightforward. The rules are transparent. The outcome depends entirely on your discipline.

01

Choose your account model

Select the evaluation account that matches your trading style and objectives. Classic, Rapid, or Discipline. Each operates within a clearly defined structured framework.

02

Trade in simulated environnement

Operate under predefined rules and risk limits. Every metric — daily loss, max loss, exposure, consistency — is visible in real time. No hidden calculations.

03

Meet the evaluation conditions

Respect the risk framework, manage exposure, and reach the defined performance criteria through consistent, disciplined execution. Minimum trading days apply.

04

Progress through the framework

Traders who demonstrate consistent discipline and risk control advance to the next stage of the FairTicks evaluation framework under identical structural conditions.

Evaluation accounts

Choose the model that fits your approach.

Each account model operates within the same risk framework. The difference is evaluation speed, structure, and focus. All accounts are simulated environments.

Rapid accounts — one shot, no reset, no extension. 15 days to prove your discipline. No daily loss restriction. Built for experienced traders who want a direct, accelerated path.
Rapid
One shot
Sprint 25K
$99 $139 -29%
Simulated capital $25,000
Profit target
$1,500
Duration
15 days
Max loss
$2,000
Trailing DD
$1,750
Account conditions
Daily loss limitNone
Stop lossOptional
Min trading days1 day
Max exposure40 units
Max risk / trade1%
No reset · No extension · One opportunity to prove discipline. If account expires or is breached, a new evaluation must be purchased.
Simulated environment · Transparent rules
Rapid
One shot
Sprint 100K
$229 $319 -28%
Simulated capital $100,000
Profit target
$6,000
Duration
15 days
Max loss
$10,000
Trailing DD
$4,000
Account conditions
Daily loss limitNone
Stop lossOptional
Min trading days1 day
Max exposure100 units
Max risk / trade1.2%
No reset · No extension · One opportunity to prove discipline. If account expires or is breached, a new evaluation must be purchased.
Simulated environment · Transparent rules
Classic accounts — the complete evaluation framework. Daily loss active, stop loss required. 30 days with reset and extension options available.
Classic
Challenge 25K
$99 $139 -29%
Simulated capital $25,000
Target phase 1
$1,500
Target phase 2
$2,000
Daily loss
$750
Max loss
$2,000
Account conditions
Trailing drawdown$1,000
Stop lossRequired
Min trading days5 days
Duration30 days
Max risk / trade1%
Reset & Extension
Reset fee$55 (max 3x)
Extension fee$45 / +30 days
Simulated environment · Stop loss required
Classic
Challenge 100K
$249 $349 -29%
Simulated capital $100,000
Target phase 1
$6,000
Target phase 2
$8,000
Daily loss
$3,000
Max loss
$4,000
Account conditions
Trailing drawdown$6,000
Stop lossRequired
Min trading days5 days
Duration30 days
Max risk / trade0.8%
Reset & Extension
Reset fee$129 (max 3x)
Extension fee$109 / +30 days
Simulated environment · Stop loss required
Discipline accounts — the strictest evaluation model. Tighter limits, more trading days required. Reset and extension available for structured second chances.
Discipline
Precision 25K
$119 $169 -30%
Simulated capital $25,000
Profit target
$1,250
Duration
45 days
Daily loss
$500
Max loss
$1,500
Account conditions
Trailing drawdown$1,000
Stop lossRequired — strict
Min trading days10 days
Max risk / trade0.5%
Consistency ruleActive
Reset & Extension
Reset fee$65 (max 3x)
Extension fee$55 / +45 days
Strictest framework · For controlled traders
Discipline
Precision 100K
$279 $389 -28%
Simulated capital $100,000
Profit target
$5,000
Duration
45 days
Daily loss
$2,000
Max loss
$6,000
Account conditions
Trailing drawdown$4,000
Stop lossRequired — strict
Min trading days10 days
Max risk / trade0.5%
Consistency ruleActive
Reset & Extension
Reset fee$149 (max 3x)
Extension fee$119 / +45 days
Strictest framework · For controlled traders

Risk framework

Built around risk control.
Not built to trap you.

Every rule exists for a defined reason. The framework is designed to reinforce discipline and not to manufacture artificial failures.

Enforced live
Daily Loss Limit
Maximum loss allowed per trading day. Calculated from your equity at 00:00 UTC. The moment this limit is hit, all positions are closed and the account is breached.
Calculated fromDaily start equity
ResetsEvery day at 00:00 UTC
Applies toClassic · Discipline
Rapid accountNot active
Hard limit
Max Loss Limit
The absolute loss ceiling from your initial capital. Once reached, the account closes immediately and permanently. This limit never changes throughout the evaluation.
Calculated fromInitial capital
IncludesOpen + closed positions
On breachAccount closed
Applies toAll account types
Dynamic floor
Trailing Drawdown
Your loss floor follows your highest equity — it rises as you profit, but never drops back. A time buffer is applied before triggering a breach, protecting against brief market spikes.
Floor calculationHighest equity − limit
BufferApplied before breach
New equity highBuffer resets
Applies toAll account types
Required
Stop Loss Required
Every position must have a defined stop loss before entry. Enforced at the system level — no exceptions. Positions without a stop are rejected automatically. This is a non-negotiable discipline rule.
EnforcementSystem level
No stop setPosition rejected
Applies toClassic · Discipline
Rapid accountOptional
Live tracked
Exposure & Position Control
Your maximum exposure is capped per account size. Position sizes are structured in Nano, Micro, and Mini cards with hard limits per trade. Exposure is tracked in real time across all open positions.
Position sizesNano · Micro · Mini
Max risk / trade0.5% – 1.2% of capital
Exposure trackingReal-time
HedgingNot allowed
Real-time alerts
Near-Breach Detection
Before any rule is breached, the platform alerts you in real time. Three escalation levels — Warning, High, Critical — are tracked live across daily loss, max loss, and trailing drawdown simultaneously.
Warning — approaching limit ≥ 70%
High — limit close ≥ 85%
Critical — immediate action ≥ 95%

Plateform Experience

A modern platform built for focused execution and full visibility

Every metric, every tick, every rule — visible in real time. No hidden calculations. No end-of-day surprises. Just a clean, focused environment built for disciplined execution.

trade.fairticks.com
Trading Rapid 
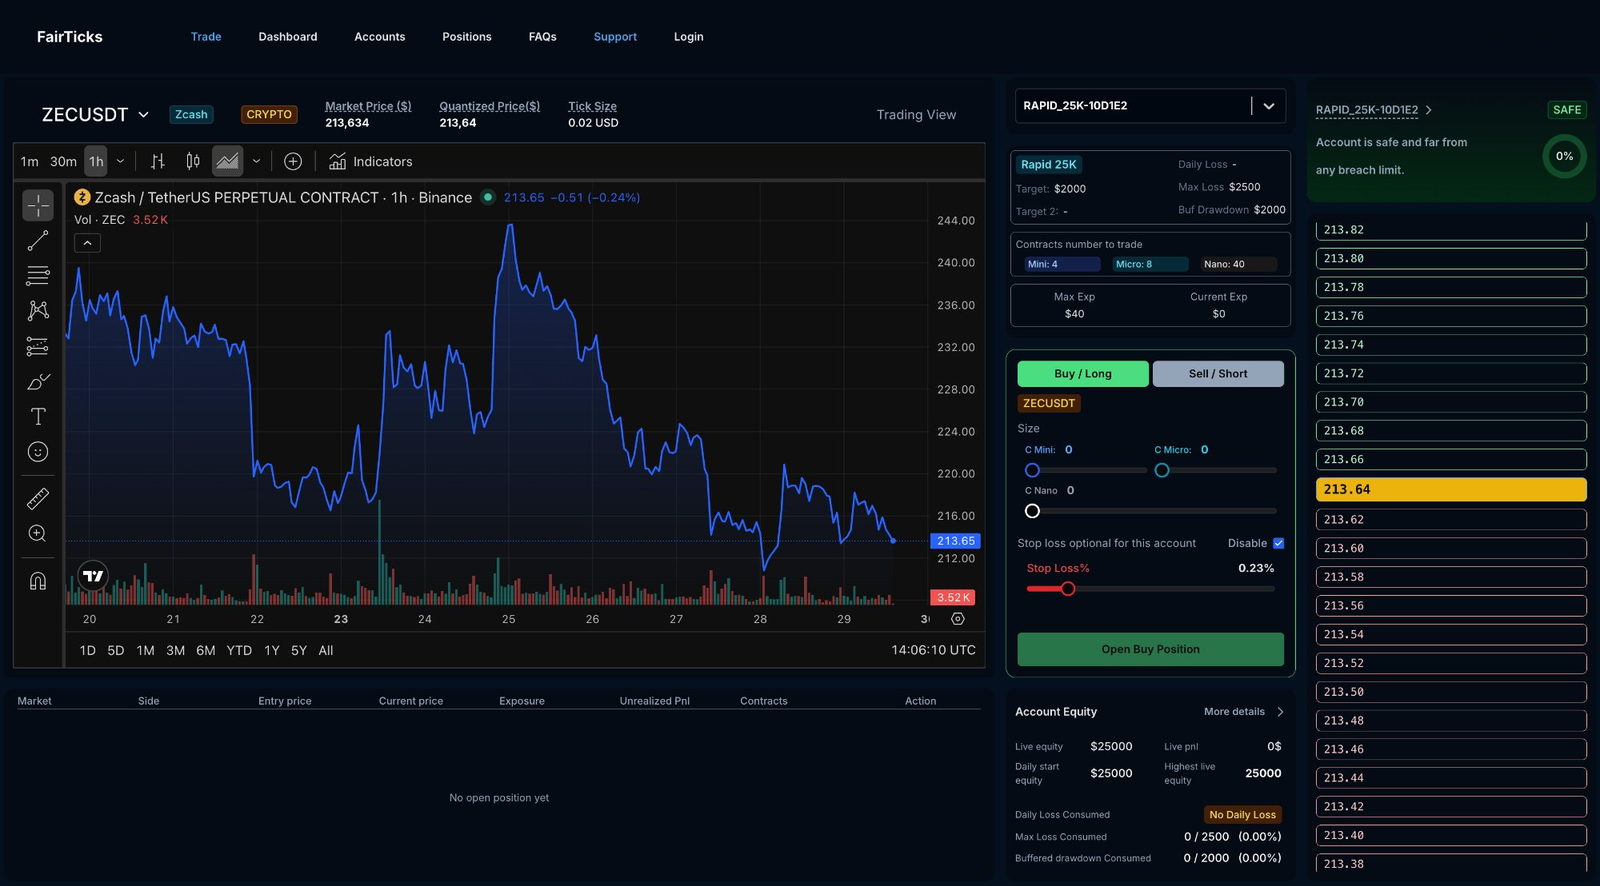
Live trading · Rapid account
Click to expand
Trading interface

Full account visibility before every position.

Your limits, exposure, and target — displayed live in the trading panel before you click Buy or Sell. No separate page. No refresh needed.

TradingView chart — 1m, 30m, 1h, all timeframes
Position sizing in Nano, Micro, Mini cards with sliders
Stop loss % — enforced before entry on Classic & Discipline
Max exposure and current exposure — live
Live equity, daily start equity, live PnL — always visible
Account equity panel
Live equity$25,000
Daily start equity$25,000
Max loss consumed0 / $2,500
Buffered drawdown0 / $2,000
trade.fairticks.com
Trading Classic 
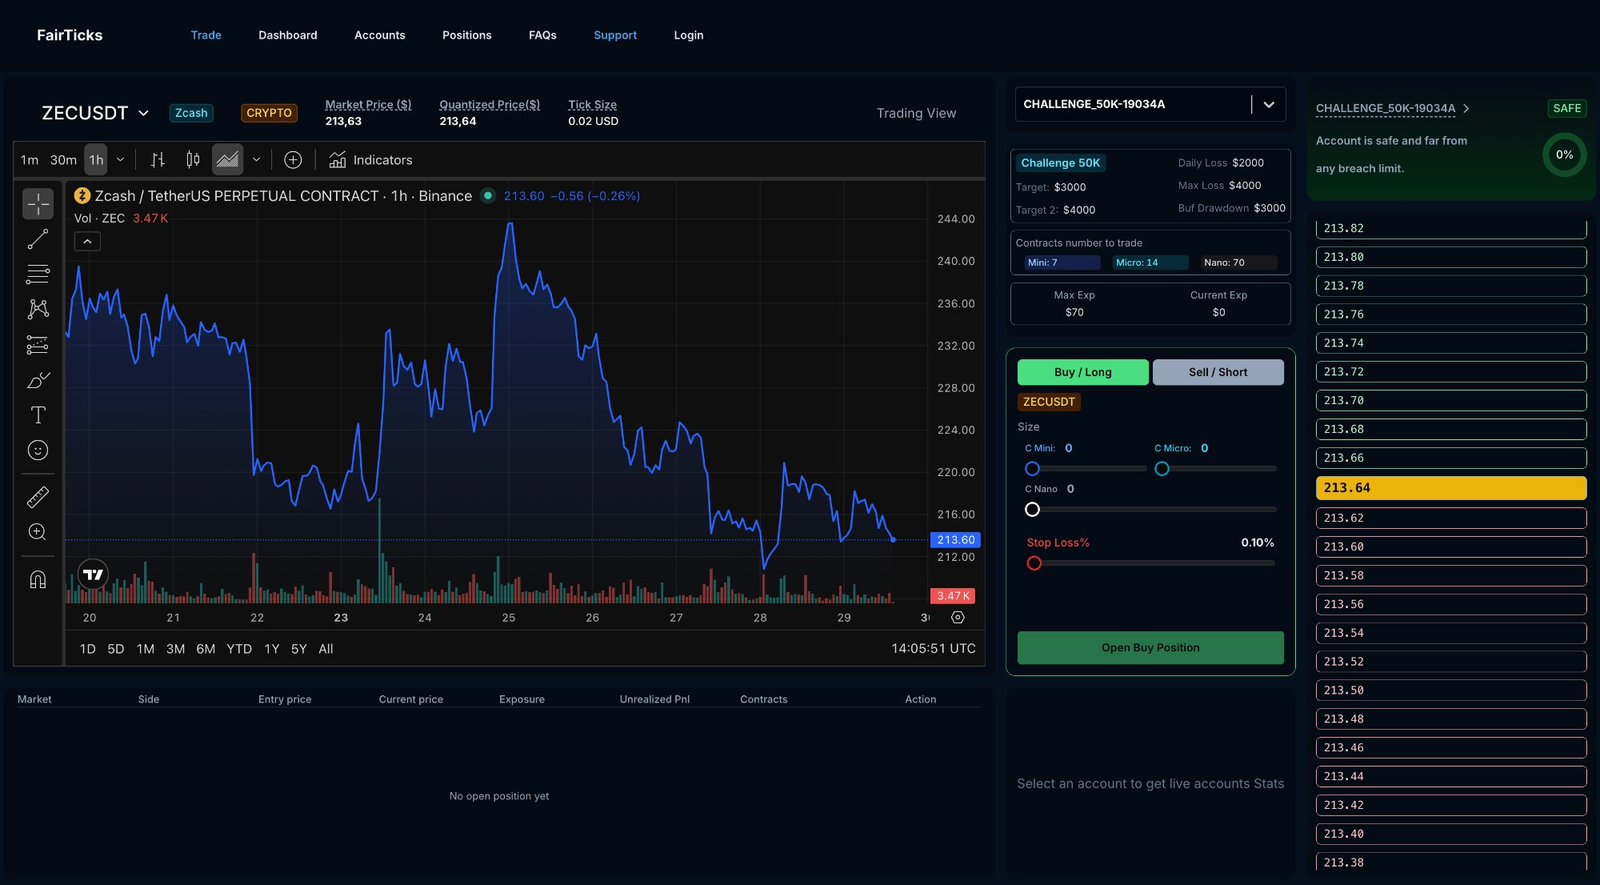
Classic account · Stop loss required
Click to expand
Account rules — always visible

Profit targets and limits. Right there. Before every trade.

Classic and Discipline accounts display Phase 1, Phase 2 targets, daily loss, max loss and buffered drawdown directly in the trading panel.

Phase 1 and Phase 2 targets displayed live
Daily loss, max loss visible before execution
Stop loss slider — set as % of position
One-click Buy/Long · Sell/Short execution
app.fairticks.com/dashboard
Dashboard 76% 
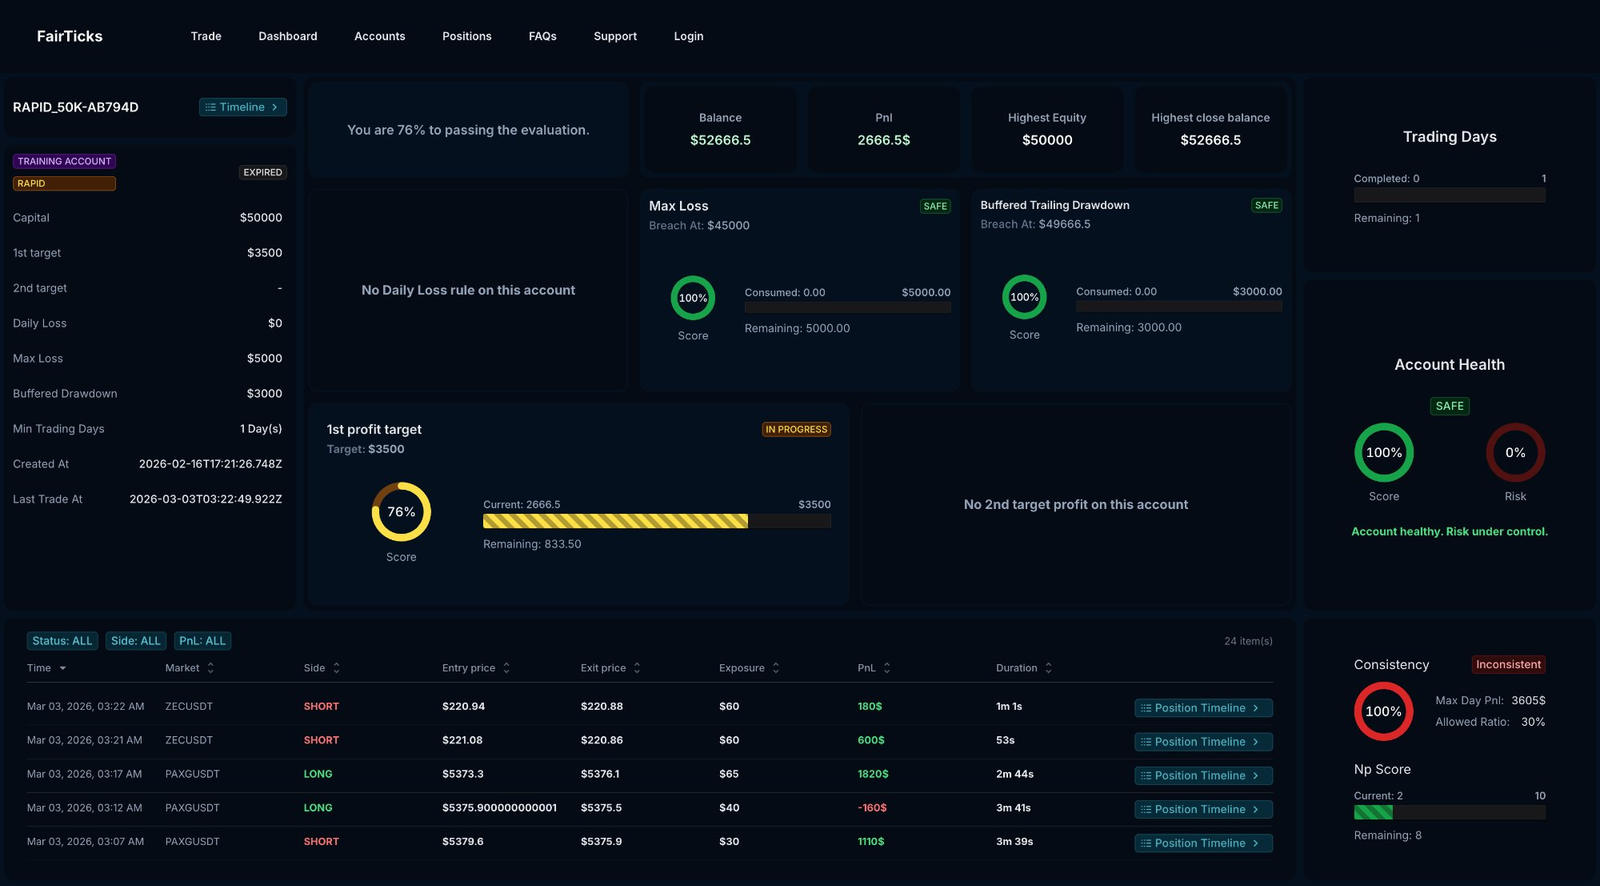
76% to passing · Rapid 50K
Click to expand
Account dashboard

Your evaluation progress. One screen. Always current.

See exactly where you stand — profit target completion, risk limits consumed, trading days, account health and position history. All in real time.

"You are X% to passing" — evaluation progress bar
Daily Loss · Max Loss · Trailing DD — circular scores
Phase 1 and Phase 2 progress bars
Full position log — entry, exit, exposure, PnL, duration
Live
Score update
5
Risk metrics
Full
Position log
app.fairticks.com/dashboard
Dashboard Challenge 100K 
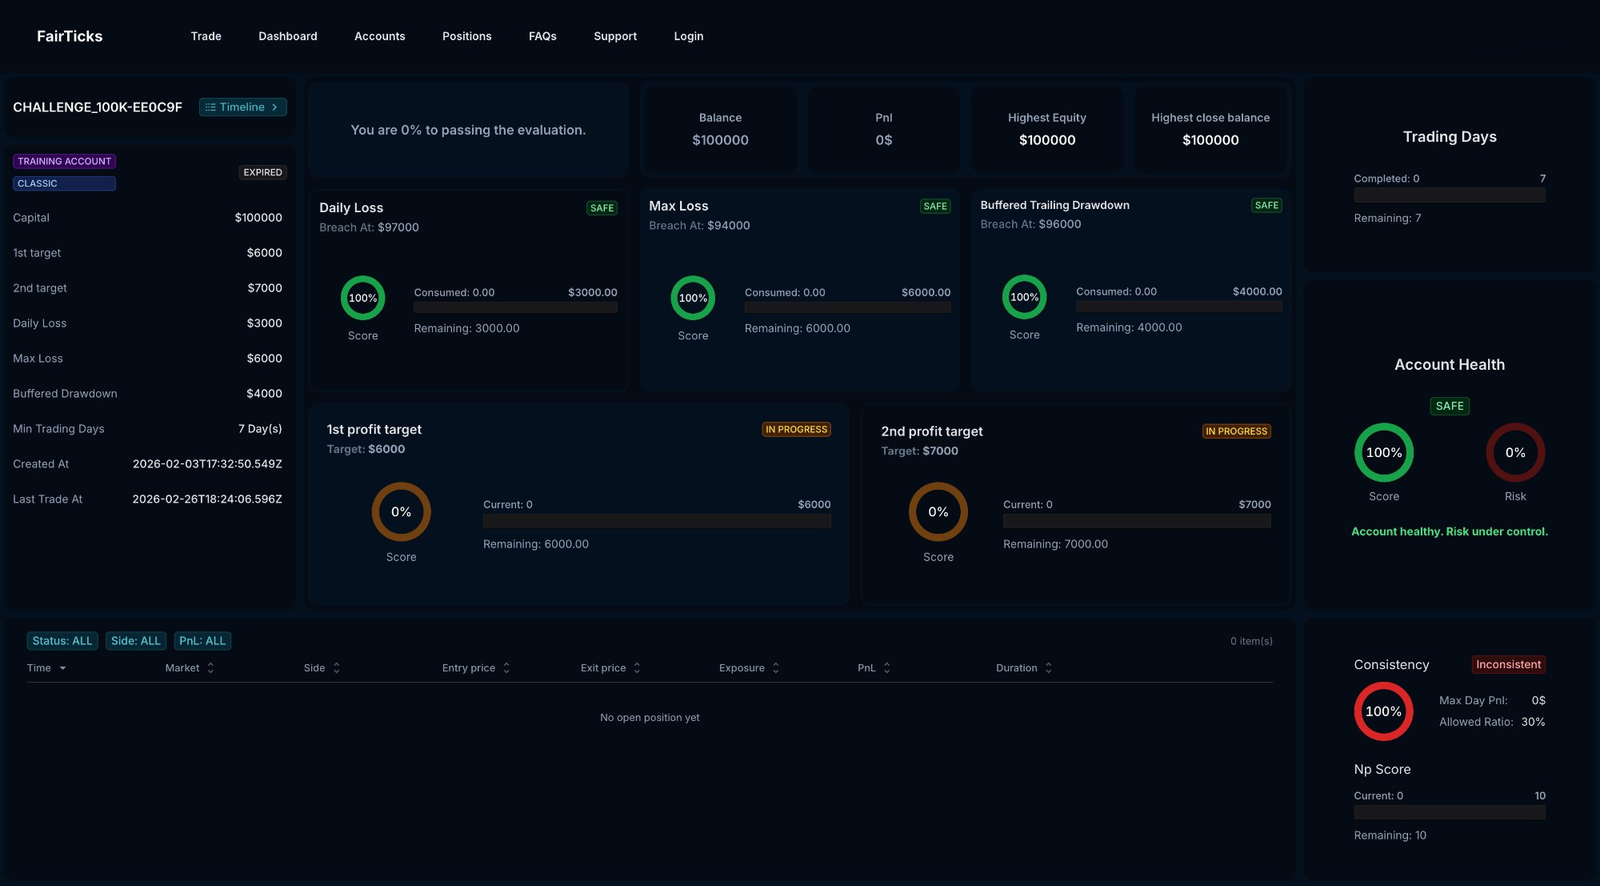
Challenge 100K · Account health
Click to expand
Account health

Discipline scored. Consistency tracked. Always.

Beyond profit — FairTicks evaluates how you trade. Consistency, risk discipline, Np Score and Account Health are tracked in real time.

Account Health score + Risk score — separated
Consistency — max day PnL vs allowed ratio (30%)
Np Score — valid trading days accumulated
Balance, PnL, Highest equity, Highest close balance
trade.fairticks.com — risk engine
Risk monitoring SAFE · 0% risk consumed
Click to expand
Live risk engine

Three levels of alert before any breach.

FairTicks warns you before you breach — three escalating alert levels, tracked live across all risk rules simultaneously via WebSocket.

Daily Loss, Max Loss, Trailing DD — monitored together
Warning → High → Critical before any breach
Trailing drawdown buffer — spike protection
WebSocket push — no refresh, no delay
Near-breach detector — live
Daily loss
14%
Max loss
71%
Trailing DD
93%
app.fairticks.com/positions
Live ticks Live tick feed · Real-time events
Click to expand
Live tick feed

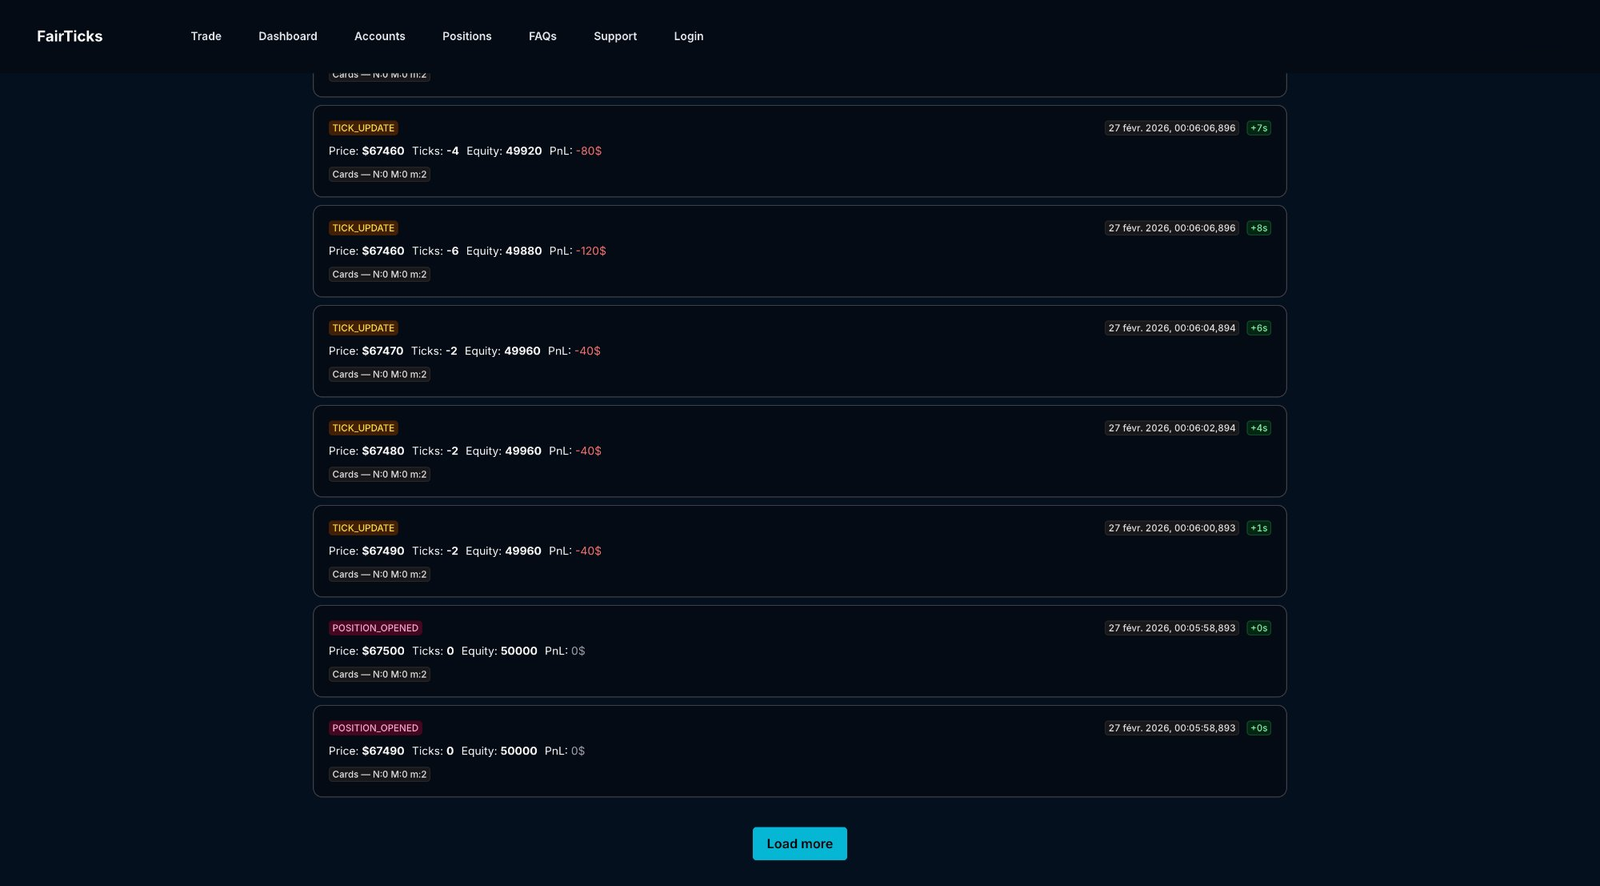
Every tick. Every event. Logged in real time.

Each price update, position open and close is logged with timestamp, ticks moved, equity and PnL. Full auditability — nothing hidden.

TICK_UPDATE — price, ticks, equity, PnL per tick
POSITION_OPENED — entry price, cards, exposure
POSITION_CLOSED — final PnL and ticks result
Full history always accessible — load more
OPENED$67,500 · Ticks: 0 · Eq: 50,000 · PnL: $0+0s
UPDATE$67,460 · Ticks: -4 · Eq: 49,920 · PnL: -$80+7s
UPDATE$67,460 · Ticks: -6 · Eq: 49,880 · PnL: -$120+8s
CLOSED$67,415 · Ticks: -17 · Eq: 49,660 · PnL: -$340+23s
app.fairticks.com/positions/logs
Position logs Position logs · Ongoing
Click to expand
Position logs

Every position. Every remaining limit. In real time.

The position log shows each active position with open PnL, ticks moved, remaining daily loss, max loss, buffered drawdown and target — updated live.

Equity, open PnL, unrealised PnL per position
Daily loss remaining, max loss remaining — per row
Buffered drawdown remaining — always visible
Target remaining — distance to evaluation goal
app.fairticks.com/timeline
Account timeline 
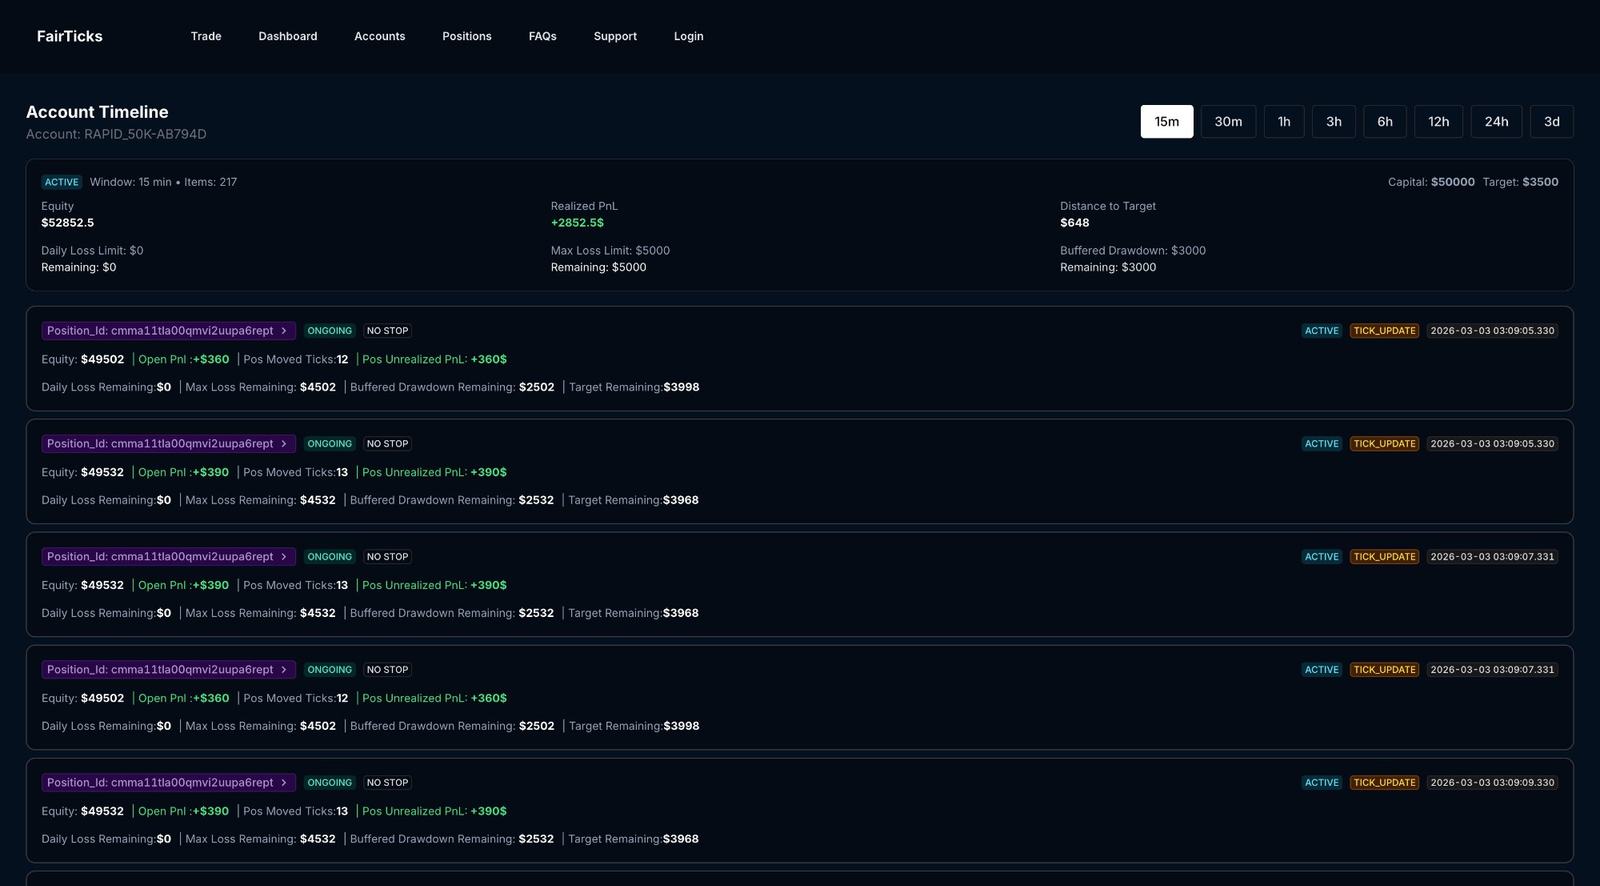
Account timeline · Rapid 50K
Click to expand
Account timeline

The complete history of your account. Every event.

The Account Timeline shows the full chronological log — equity at each window, realized PnL, distance to target, and every position update in context.

Time windows: 15m, 30m, 1h, 3h, 6h, 12h, 24h, 3d
Equity, realized PnL, distance to target per window
Max loss limit, buffered drawdown remaining per row
217 items — full account audit trail
Timeline header — Rapid 50K
Equity$52,852.5
Realized PnL+$2,852.5
Distance to target$648
Max loss remaining$5,000
app.fairticks.com/positions/timeline
Position timeline 
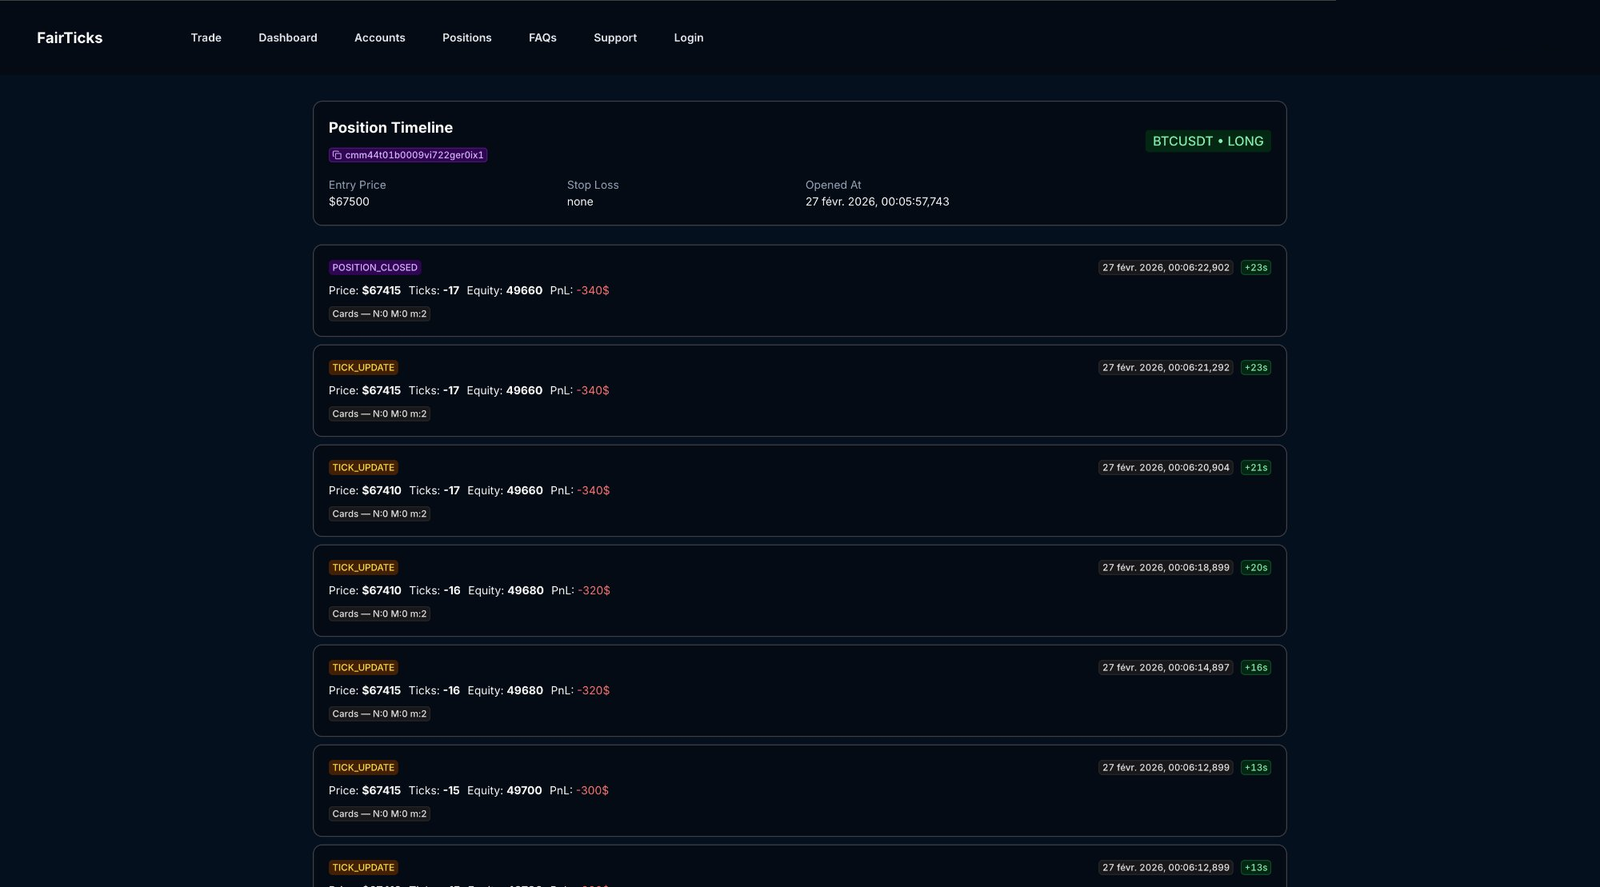
Position timeline · BTCUSDT Long
Click to expand
Position timeline

Every position. Full tick-by-tick audit trail.

For each position, the Position Timeline shows the complete tick log — entry, every price update with ticks and PnL, and the final close. Nothing is hidden.

Entry price, stop loss, opened at timestamp
TICK_UPDATE: price, ticks moved, equity, PnL
POSITION_CLOSED — final settlement, ticks result
Market + side (BTCUSDT · LONG) always visible
app.fairticks.com/analytics
Analytics 
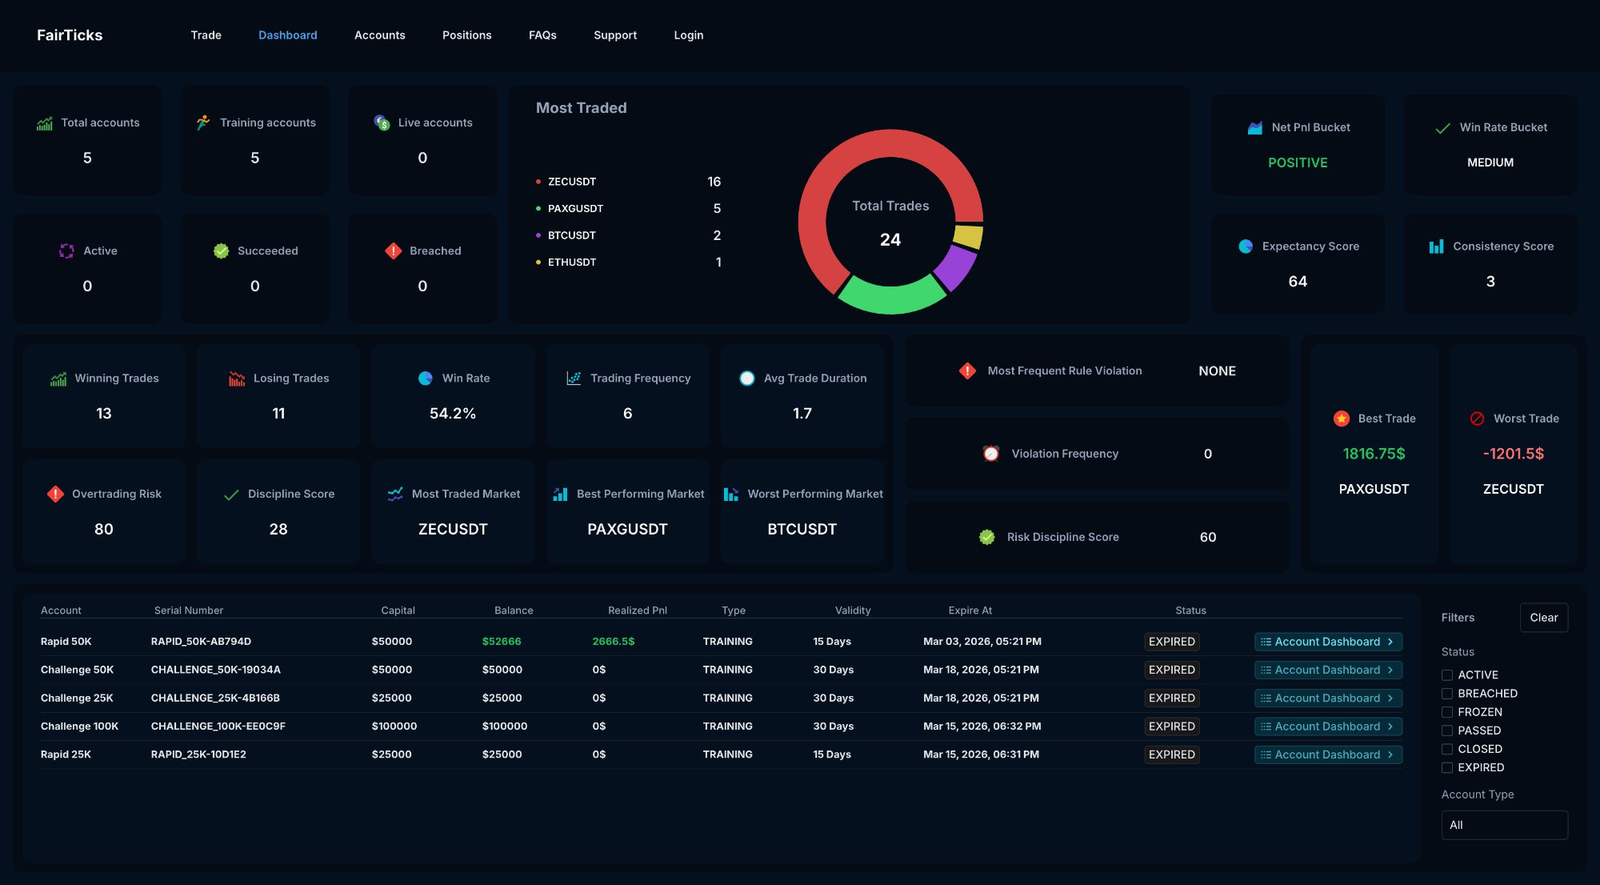
Performance analytics · All accounts
Click to expand
Performance analytics

12+ metrics. Know exactly how you trade.

The analytics dashboard gives a complete behavioral picture — not just profit. Win rate, discipline score, overtrading risk, best and worst trades, per-market breakdown.

Win rate, winning/losing trades breakdown
Overtrading risk score + Discipline score
Best and worst performing market
Most traded market — donut chart breakdown
Trading frequency + avg trade duration
12+
Metrics tracked
Per
Market breakdown
Live
Score update

FAQ

Questions we hear most.

If your question is not here, the full rules framework and documentation are one click away.

Lorem ipsum dolor sit amet, consectetur adipiscing elit. Ut elit tellus, luctus nec ullamcorper mattis, pulvinar dapibus leo.

Lorem ipsum dolor sit amet, consectetur adipiscing elit. Ut elit tellus, luctus nec ullamcorper mattis, pulvinar dapibus leo.

Retour en haut